Identifying Slow Functions
Performance Trace
A lot of page rendering in C1 CMS is encapsulated in CMS Functions.
C1 CMS allows you to track how much time each CMS Function takes to execute when a page loads.
To view this performance trace:
- Log in to the CMS Console of your website.
- Select a page you want to trace.
- Click the View Mode button (the first button to the right of the address bar).
- Select CMS Page Speed.
Alternatively:
- While logged in to the CMS Console, in the address bar of your web browser, type in the URL of the page whose performance report you want to see.
- Append the c1mode query parameter set to perf to the page URL ('
?c1mode=perf'). For example:http://www.contoso.com/Products?c1mode=perf - Press Enter.
Important: Make sure that you are logged in before running the performance report.
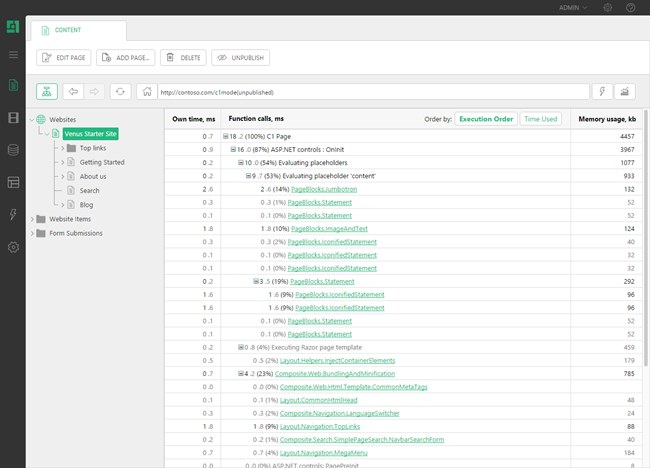
The activities and functions are presented nested in a table. You can expand and collapse them in the table at will.
- The first column ("Own time") shows how many milliseconds the activity or function takes to execute without its child activities/functions.
- The second column ("Function calls") features the name for the activity or function and shows how long (in both ms and %) it takes to complete the activity or execute the function.
- The third column ("Memory usage") shows the memory usage in kilobytes.
Tracking custom code performance
If you also have custom C# code executed when a page loads, you can add performance tree labels and times for it to the report, too. Use this code:
using (Composite.Core.Instrumentation.Profiler.Measure("My Custom Label"))
{
  // your code here – the time used in here is measured
  // and labeled with your custom label defined above
}
When a "Measure" block is encountered, a new nested node in the performance tree is created. Nesting "Measure" blocks creates nested performance tree elements.
Sample:
using System;

namespace Demo
{
  public class Functions
  {
    public static string ShowDate()
    {
      using(Composite.Core.Instrumentation.Profiler.Measure("Show Long Date"))
      {
        return DateTime.Now.ToLongDateString();
      }
    }
  }
}

